Using the contrib release of the OpenTelemetry Collector (GitHub) container, you can ship the standard JSON Lines logs generated by the Docker engine to OpenObserve using a container in the self-same stack. This approach is not ideal for a serious production or enterprise deployment but will be sufficient if you have a simple self-hosting use case like mine.
The Docker engine writes the stdout and stderr logs from containers (i.e. the output of docker logs <container_id/container_name>) to /var/lib/docker/containers. This directory will contain a directory per container, named for the 64-char hexadecimal container ID, and a log file in each subdirectory named <container_id>-json.log. OTEL Collector contrib is needed to get access to the filelog receiver with support for the docker format.
I predominantly manage Docker with Compose so here’s an example of how I’ve deployed it in my various Compose stacks.
otel:
  container_name: otel
  environment:
    ZO_DATA_DIR: /data
  env_file:
    - otel.env
  image: "otel/opentelemetry-collector-contrib:latest"
  user: "0:0"
  volumes:
    - ./otel.yaml:/etc/otelcol-contrib/config.yaml
    - /var/lib/docker/containers:/containers
Yes, that’s a
userdefinition grantinguid=0;gid=0- the/var/lib/docker/containersdirectory (and parent) have tight permissions which you should modify sensibly using something likeo+rxto let the logs be read without doing this unsafe method. This example is to show the minimal effort required approach that will immediately start shipping logs. If you need this safer approach, modify the permissions and drop theuserdefinition.
Create otel.env with the following content:
COLLECTOR_BEARER_TOKEN=dXNlckBkb21haW4uY29tOnVzZXJwYXNzd29yZA==
This bearer token is generated using user credentials from OpenObserve. If you navigate to /web/ingestion/custom/logs/otel on your OpenObserve instance, you’ll find the OTEL Collector configuration with the bearer token already generated. If you want to produce it manually or programatically, just Base64 encode the string user@domain.com:userpassword (remember to -n if you’re echoing it on the command line).
The otel.yaml configuration file should take a form similar to the following.
receivers:
  filelog:
    include_file_path: false
    include:
      - /containers/*/*-json.log
    operators:
      - id: container-parser
        type: container
        format: docker
        add_metadata_from_filepath: false

processors:
  transform:
    error_mode: ignore
    log_statements:
      - set(log.attributes["container_name"], log.attributes["attrs"]["tag"])
      - delete_key(log.attributes, "attrs")
  logdedup:
  batch:

exporters:
  otlphttp/openobserve:
    endpoint: <your_openobserve_instance>/api/default
    headers:
      Authorization: Basic ${env:COLLECTOR_BEARER_TOKEN}
      stream-name: default

service:
  pipelines:
    logs:
      receivers:
        - filelog
      processors:
        - transform
        - logdedup
        - batch
      exporters:
        - otlphttp/openobserve
The receiver targets the JSON Lines output generated for all containers, formats it automatically as Docker logs, and passes to the processors. By default, the container logs are tagged with the 64-char container ID. This is opaque outside of the system context so I modify the Docker daemon.json (to be edited or created in the /etc/docker/ directory).
{
  "log-opts": {
    "tag": "<someusefulname>/{{.Name}}"
  }
}
Take a look at customising log driver output for clarification on the format of the tag value. I stick the name or hostname of the host system in <someusefulname> which then means that container_name attribute for a log generated by an example container called nginx on the host vader would look like vader/nginx. The Docker service needs to be restarted after modifying daemon.json.
I use the processors step to do some tidying up. The tag gets surfaced on the raw log object as a subordinate key like:
{..."attrs": {"tag": "vader/nginx"}...}
This can be yanked out to a better attribute with the transform processor and then be deleted.
I’ve omitted another processor step that I tend to use which drops any logs specifically for openobserve as it’s terribly noisy. This is just a preference and probably doesn’t make sense for most use cases but here’s the filter anyway. If you use the pattern for the daemon.json proposed, make sure to write the full expected container_name, e.g. vader/openobserve.
processors:
  ...
  filter:
    error_mode: ignore
    log_conditions:
      - log.attributes["container_name"] == "vader/openobserve"
If you use it, remember to add it to the service pipelines:
service:
  pipelines:
    logs:
      ...
      processors:
        ...
        - filter
        ...
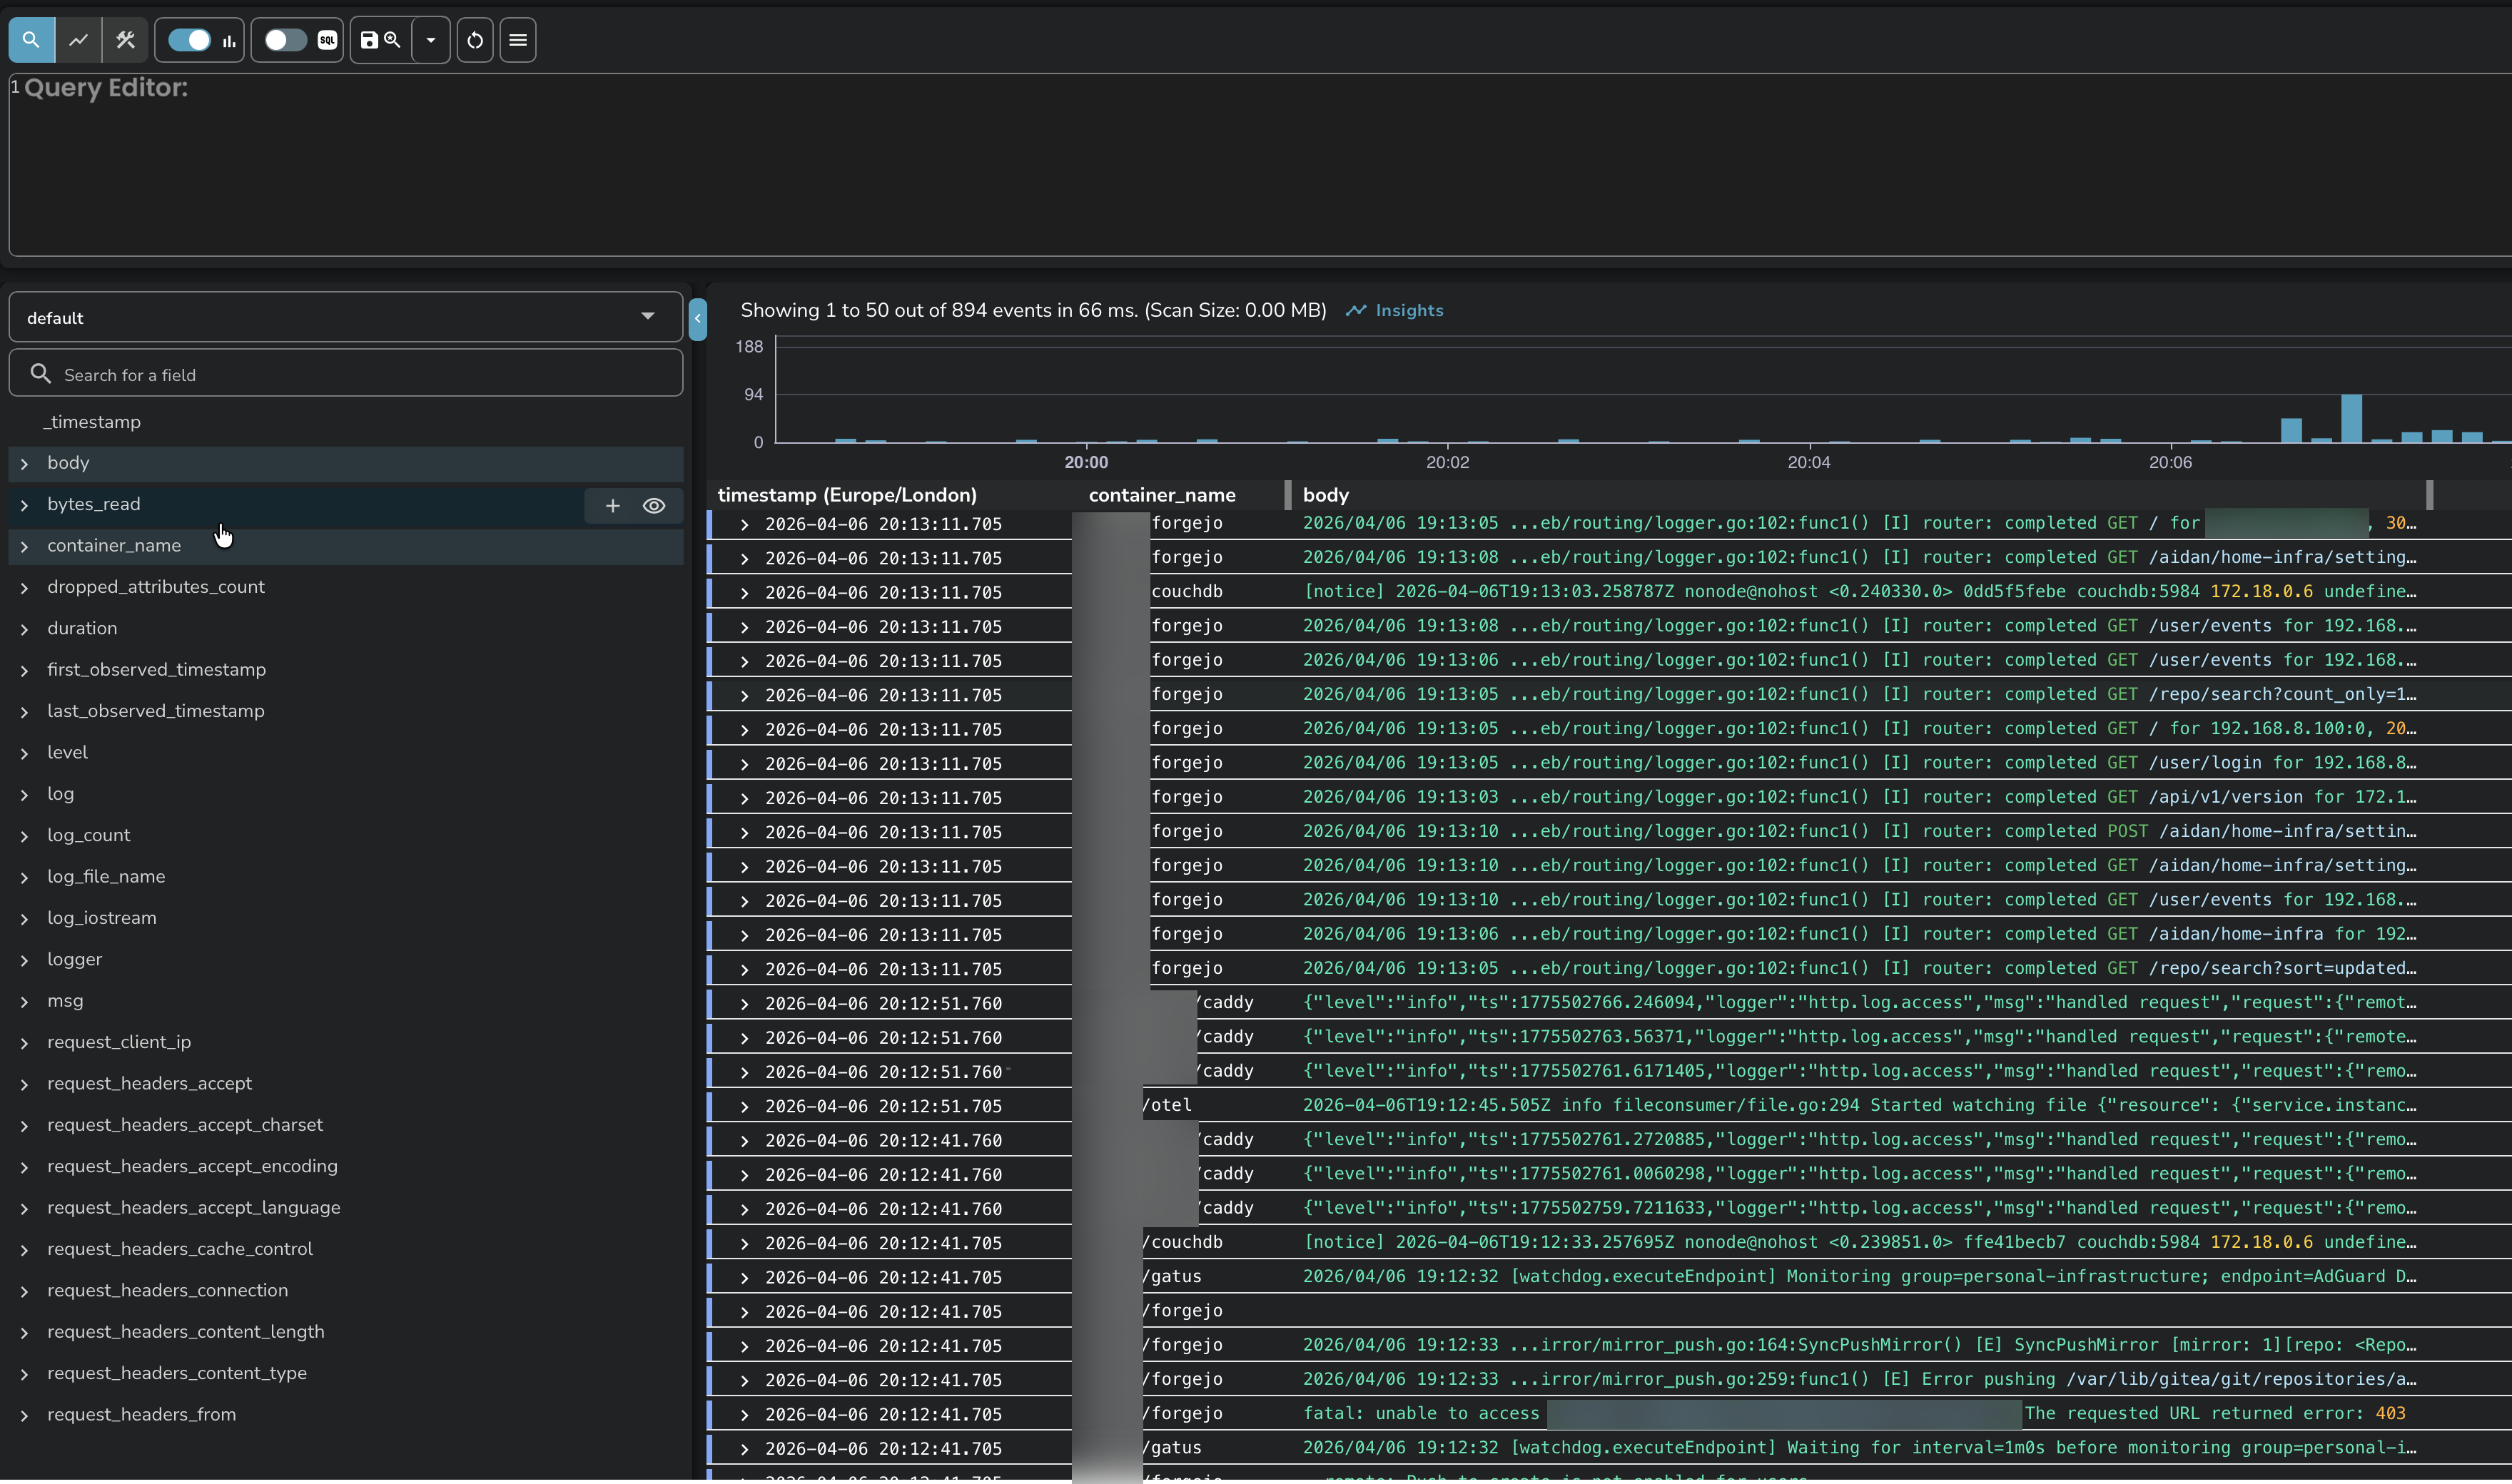
Once up and running, the OTEL Collector will start shipping to OpenObserve under the specified stream and you can dig into the logs. Here’s a small example of the logs in one of my instances, with the container and body added to the table to highlight them.